Driving treatment decisions on 5 Nov 2015
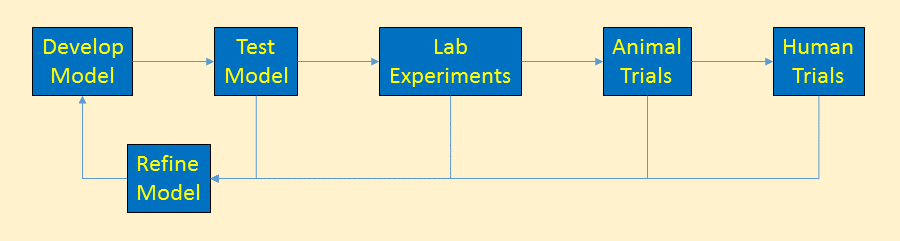
Scientist use cancer models to understand cancer. These models describe the rules cancer follows – how it starts, grows, metastasizes, and ultimately how it can be killed. Reviews of models generate new treatment ideas that models indicate should be successful.
Models of how cancer works drive the direction of cancer funding, research, prevention and treatment decisions. Poor models lead to research producing ineffective treatments.
This post looks at the dominant cancer model used by researchers today.
[I became interested in cancer models because each model has its own ideas about the most effective treatments. Treatments suggested by this model are sometimes the absolute wrong treatment under another model. So I began to look into the differences in their recommendations. I wanted to find overlap – treatments that would work well under any model and thereby improving my odds of successful treatment. The importance of surgical resection as a cure stands out very clearly.]
Clonal Evolution Model
You are probably familiar with the dominant cancer model, the clonal evolution model, first proposed in 19761 where a single cell eventually gains enough mutations to become a full-fledged cancer tumor cell. This cancer cell continues to divide uncontrollably to form a tumor mass.
Mutation Accumulation Under the Clonal Evolution Model
As the tumor grows, defects in the replication process cause “daughter” cells to add more mutations. Following evolutionary rules, cells that compete better for blood and nutrients become more plentiful. The result is a tumor mass that contains cells with various colonies of mutations dominated by colonies that proliferate best.
The resulting tumor is considered by researchers to be a heterogeneous collection of tumor cells2. This means that all tumor cells are not identical – they contain unique sets of mutations. It is thought that some of the earliest mutations will be present throughout the tumor. Mutations occurring in sections of DNA not used by these cells are called passenger mutations and don’t appear to be harmful3. But mutations that directly result in cells becoming cancerous are called driver mutations. Finding and targeting a driver mutation should lead to effective treatments. Ideally we would like to target a driver mutation that is present throughout the entire tumor.
“Precision medicine” treatments rely on genetic testing from biopsies of tumors. Unfortunately, these biopsies only grab a portion of the tumor and this sample may not be representative of the entire tumor. If a targeted therapy is identified, it may only be effective on the sampled section of the tumor. Tumor cells without the target may be unaffected and continue growing. Effectiveness depends upon “luck of the draw” in finding the right driver mutation.
[It is here where I think the importance of germline genetic testing comes in. This is look for inherited cancer-causing mutations from a sample of saliva or blood. If one of these mutations is found, I think it has a good likelihood of being a driver mutation present throughout the entire tumor. My BRCA2 mutation was found this way and directly led to my platinum-based chemotherapy treatment that reduced the tumor size by 80% (diameter) and enabled surgery.]
Tumor Growth under the Clonal Evolution Model
As the tumor continues to grow, eventually mutations will develop that allow tumor cells to metastasize and spread to distant organs.
For over 30 years we’ve been developing new treatments based on this model. Treatments are reducing the size of tumors, but complete elimination without relapse is uncommon. The lack of success has some researchers looking at different cancer models.
Clonal Evolution Model on Chemotherapy
Experience has shown that chemotherapy is usually only effective on a portion of the tumor. Its application can shrink the tumor and change the types of mutations prevalent.
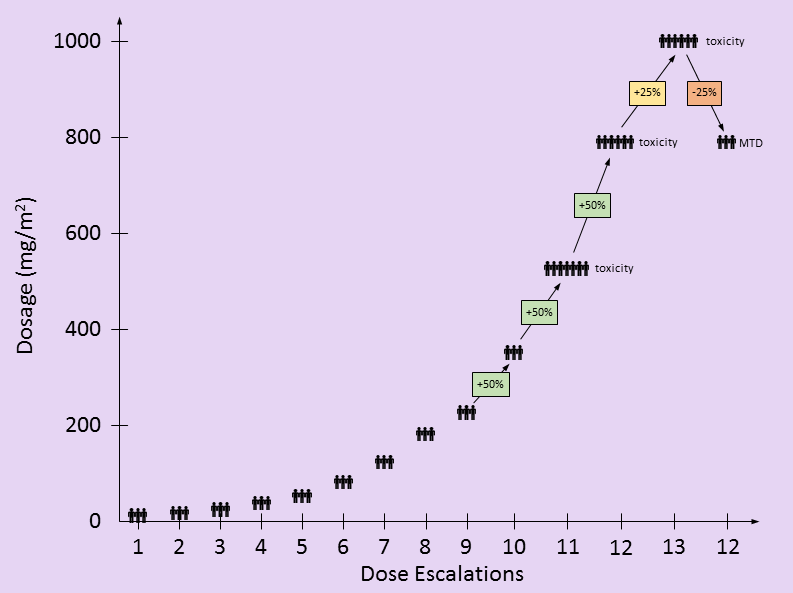
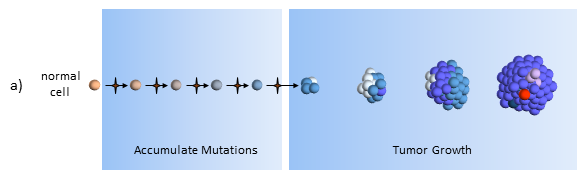
The figure below describes how the tumor grows and responds to chemotherapy. When the tumor size is small (below the dashed line) it may cause adverse side effects, but it is undetectable by scans. This phase can last years and patients typically don’t know they have cancer while the tumor slowly grows in size.
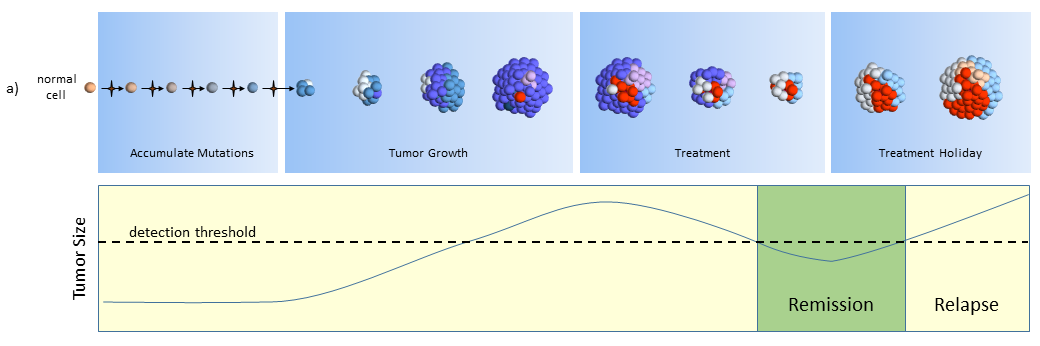
Clonal evolution model response to chemotherapy treatments
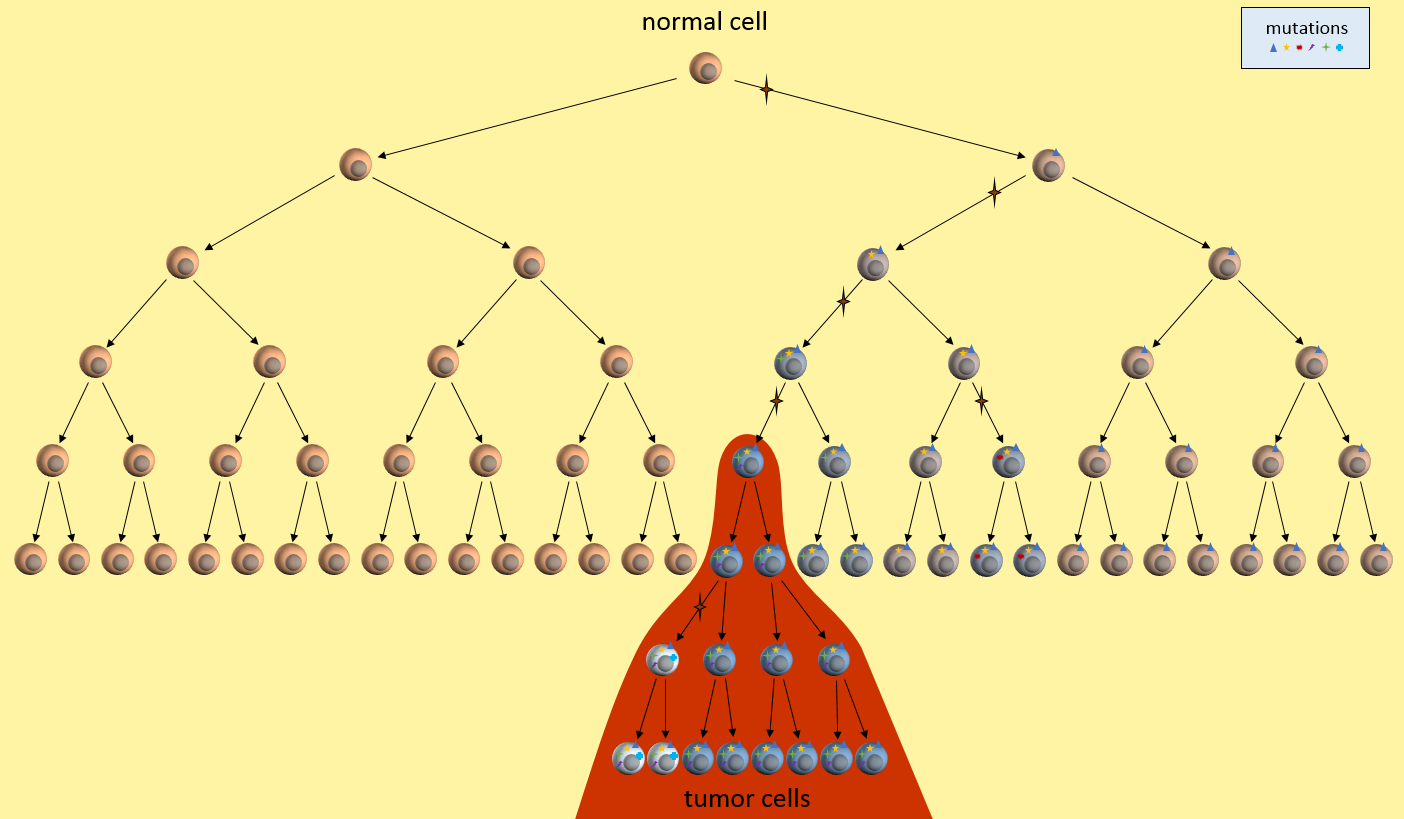
Accumulate Mutations
In the clonal evolution model a normal cell accumulates mutations as it divides. After enough mutations have accumulated, the cell becomes cancerous. My post The Hallmarks of Cancer describe the cell characteristics these mutations provide for the formation of cancer.
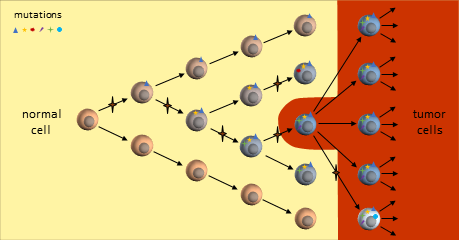
Tumor Growth
The original tumor cell divides uncontrollably and its “offspring” create additional mutations, as indicated by the different colored cells. Some offspring grow and divide better than others. This is evolution on a very rapid time frame. In cancers cells, mutations happen much more quickly than in normal cells because of the loss of DNA repair mechanisms. Most mutations don’t survive, but some do well – even better than previous tumor cells. This is survival of the fittest within the tumor.
The tumor is said to be heterogeneous, meaning it is composed of cancer cells with many different kinds of mutations. In the figure above, tumor cells with different sets of mutations are shown as cells with different color. Tumor heterogeneity has important negative implications for genetically targeted therapies (i.e. precision medicine).
Treatment
After the tumor is large enough to be detected, treatment begins. Cell mutations continue to happen and new treatment-resistant cells begin to proliferate while the others are destroyed. In this phase, the tumor may grow or shrink depending upon how well the tumor cells resist and adapt to the treatment.
In the figure above, the blue and pink colonies are susceptible and killed off by the chemotherapy. A new colony of mutated cells (light blue) are unaffected by treatment and grow rapidly. But overall, the tumor shrinks below the size of detection where the patient is then considered to be in remission and treatment is halted. Patients may assume that the tumor is completely gone, but most likely it is present but too small to detect (remission, not cured).
Colonies of cells susceptible to treatment make up smaller and smaller portions of the tumor. Treatment effectiveness comes to a halt when the susceptible cells have been killed, leaving behind the treatment-resistant colonies.
[Treatment targeting a driver mutation may be much more effective – even resulting in a long-term remission. Unfortunately, because of the tumor’s ability to mutate to readily, a mutation may come that works around even this driver mutation. Evolution is a very powerful process and is working in the tumor’s favor. Surgical resection before it gets the chance to mutate again may still be the surest cure.]
Treatment Holiday
After treatment is halted, tumor cell growth of remaining cells continues unrestrained. By this time, the tumor may be composed of completely different types of tumor cells, ones that are largely unaffected by previous treatments.
What remains is a treatment-resistant tumor. Another treatment must be selected. A new biopsy might identify another treatment that will also likely treat a portion of the tumor.
Another View of the Clonal Evolution Model
The figure below presents another way to look at tumor growth in the clonal evolution model4. Each colored area represents a cell colony with a specific set of mutations. Time progresses to the right. The height of each colored area represents the quantity of cells in the colony. New mutations are represented by stars and may originate from any established colony. The figure shows that these new mutations can originate in any part of the tumor and then competes for space and resources with the others.
Eventually, one of the colonies acquires the ability to metastasize and migrates to another organ.
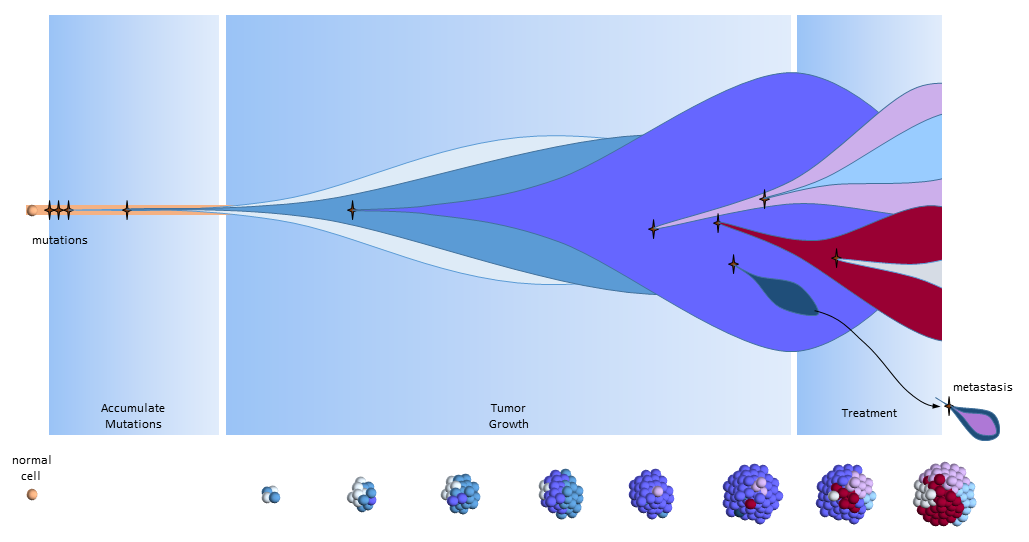
Clonal Evolution Model
Summary
The clonal evolution model of cancer is the widely accepted explanation for tumor growth and response to treatments. Publications on the topic have been ongoing for quite some time.
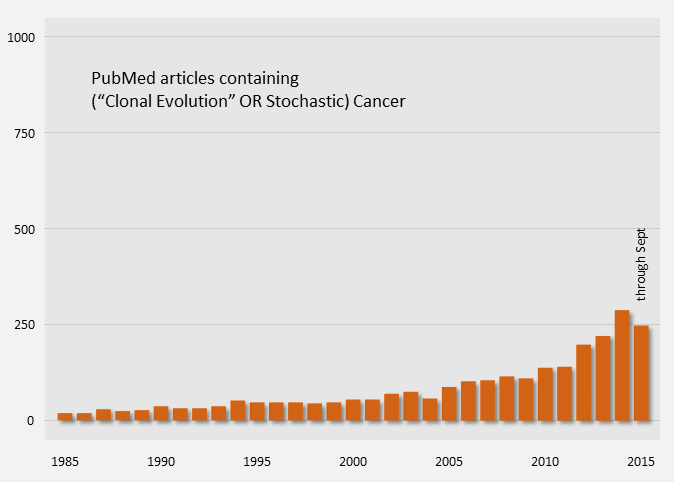
Clonal Evolution Model Publication Count
The clonal evolution model describes how cancer develops from a single cell to become a tumor, becomes heterogeneous, responds to treatment, and becomes resistant to treatments.
The model points to a few effective treatment options for patients.
- Surgical resection before metastases
- Treatments targeting driver mutations
Much current research and development is being done to target mutations found in tumors. The next model I’ll discuss says that we’re targeting the wrong mutations and wrong tumor cells.
References
[1] Nowell PC (October 1976). “The clonal evolution of tumor cell populations”. Nature 194(4260):23-8. PMID: 959840.
[2] Heppner GH. (Jun 1984). “Tumor heterogeneity”. Cancer Res. 44(6):2259-65. PMID: 6372991.
[3] Greenman, Chris, et al. (Aug 2006). “Statistical Analysis of Pathogenicity of Somatic Mutations in Cancer”. Genetics 173(4):2187-2198. PMID: 1569711.
[4] Yates LR, Campbell PJ. (Nov 2012). “Evolution of the cancer genome”. Nat Rev Genet. 13(11):795-806. PMID: 3666082.