The 2011 approval of FOLFIRINOX for pancreatic cancer1 was a breakthrough for pancreatic cancer. The one-year survival rates doubled compared to the current best available treatment, gemcitabine. However, concern for toxicity and adverse side effects quickly restricted patients to only the healthiest. In this post, we examine peer-reviewed, published evidence for low dose FOLFIRINOX maintaining effectiveness and reducing patient side effects.
How Treatment Doses are Set
I’ve written previously here how researchers set doses with phase 1 clinical trials. Briefly, in a 3×3 trial design, groups of 3 patients receive a specified dose level and are then assessed for toxic effects. If nothing “bad” happens, the next group of 3 patients receive a slightly increased dose. This cycle repeats until patients experience too many toxic effects. An additional group of patients receives a lower dose to assure the limited toxicity.
The adverse reactions of a handful of patients determines the dosages for all other patients. Note that the treatment effectiveness is not a consideration in setting was is aptly called the Maximum Tolerated Dose (MTD). To be sure, later clinical trials may see additional toxicities and modify the doses or schedule a little, but usually not much. The key idea driving this is that more chemotherapy is better.
Minimum Effective Dose
Ideally, we’d like to discover the Minimum Effective Dose (MED) for any treatment. That could entail large clinical trials with several cohorts taking different doses. To detect small differences in treatment outcomes, we must enroll large groups of patients. Tying up the few patients willing to participate in clinical trials in MED studies would delay development of new treatments.
Is More Always Better?
Smaller doses may be just as effective in treating tumors, and almost certainly result in fewer adverse side effects. Fewer side effects allow patients to stay with treatments longer. There have been a few studies with low dose FOLFIRINOX, so let’s review what they found.
The Evidence for Less FOLFIRINOX
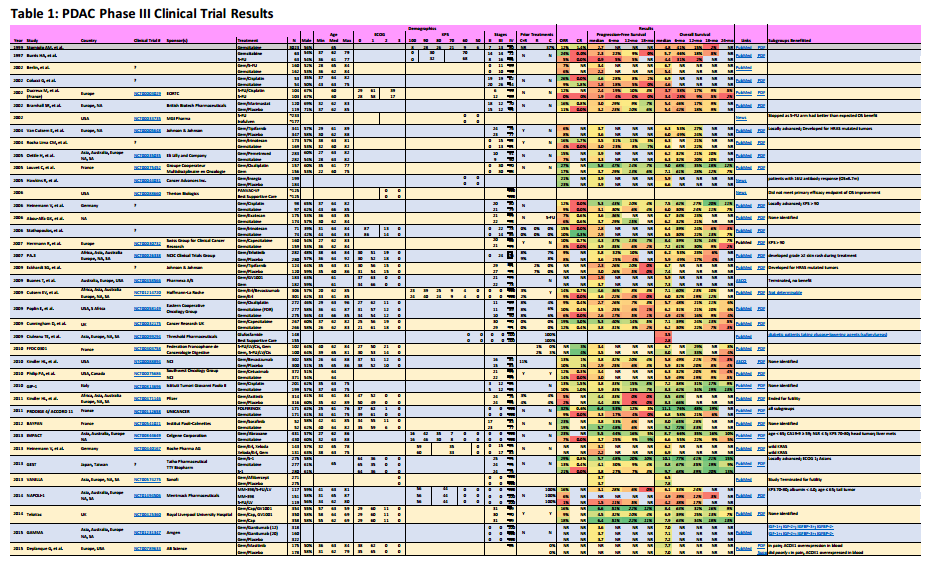
I summarize four studies that report on efficacy and side effects of low dose FOLFIRINOX in metastatic pancreatic cancer. The following table summarizes these studies and the phase III PRODIGE 4/ACCORD 11 approval trial.
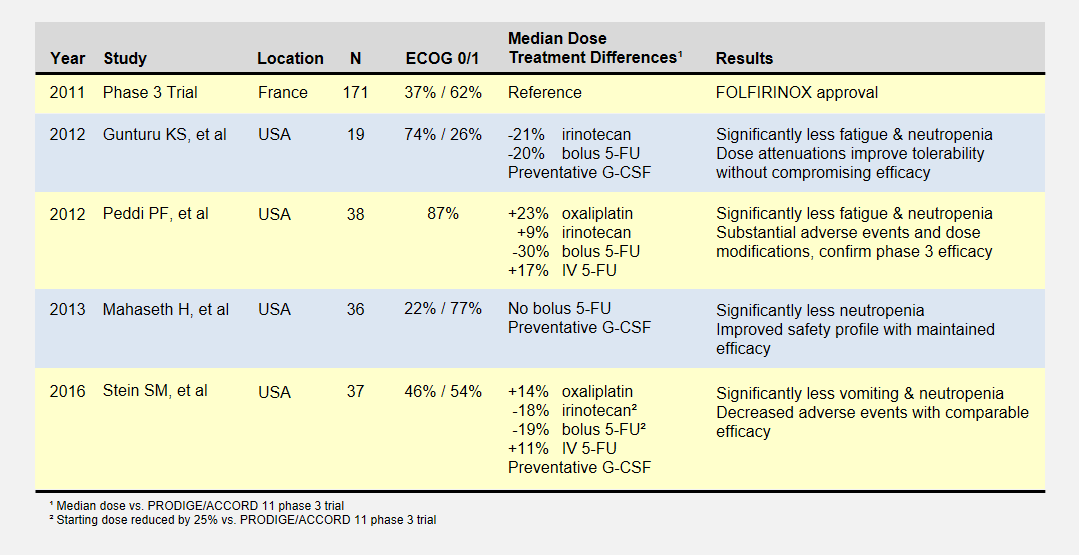
Overview of Low-Dose FOLFIRINOX Studies
I’ve reported the median dose levels, when available, as compared to the phase 3 FOLFIRINOX clinical trial. Many patients did not start at a full dose, and most had dosage reductions sometime during each study.
About the Studies
The Gunturu KS, et al2 retrospective review included Yale University previously-treated patients from June 2010 to July 2011, documenting their doses, toxicities, and survival results. Reduced doses were not by design, but rather a result of physician discretion. All patients received preventative G-CSF (i.e. neupogen) to prevent neutropenia. This study had a high percentage of healthiest patients.
The Peddi PF, et al3 retrospectively reviewed the FOLFIRINOX experiences of Washington University, the Mayo Clinic, and the University of Wisconsin to compare US “real-world” experiences to the phase 3 clinical trial held in France. Physicians reduced doses at their discretion, not by study design.
Mahaseth H, et al4 retrospectively reported on Emory University’s modified FOLFIRINOX regimen that omitted bolus 5-FU and administered G-CSF to all patients.
Yale University later conducted the Stein SM5, et al prospective study after the promising results in the Gunturu KS study. Starting Irinotecan and bolus 5-FU doses were reduced by 25%, and further at physician discretion. This phase 2 clinical trial (NCT01523457) may provide the most rigorous results.
Patient Responses
I’ve summarized these study’s adverse patient reactions and tumor response statistics in the table below. Relative Risks of greater and less than 1.0 indicate that the study recorded more or less of a particular event, respectively, compared to the phase 3 clinical trial. As an example, a relative risk of 0.3 means that particular event happened 30% as often as in the phase 3 clinical trial. Bold numbers indicate statistically significant findings (p-value < 0.05). Because of the small study sizes, many promising findings did not reach statistical significance.
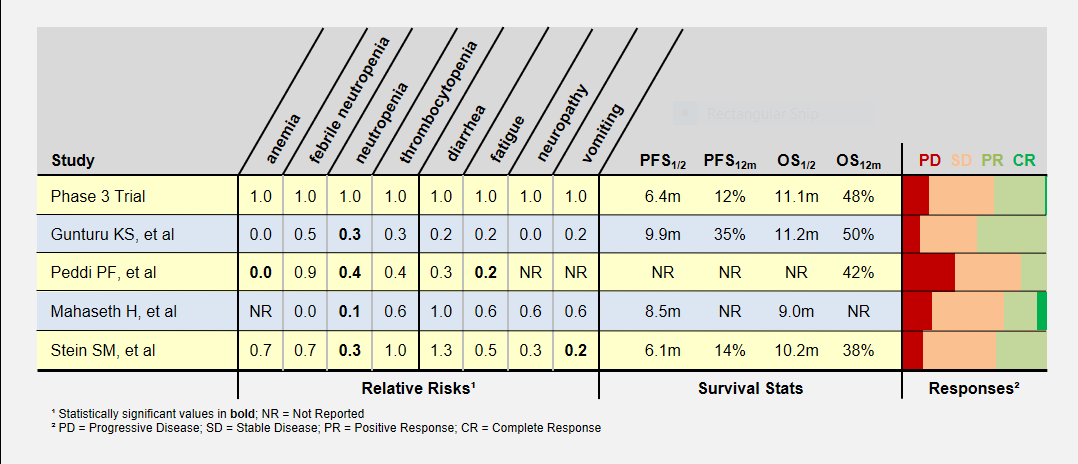
Patient Responses in Low-Dose FOLFIRINOX Studies
Progression-Free (PFS) and overall survival (OS) were similar in all studies (the accurate statement is that they were “not found to be different”). Toxicity levels were almost uniformly lower in all low dose FOLFIRINOX studies.
Colored bars represent tumor responses to treatment, with width corresponding to patient counts. Depending upon an individual’s treatment goals, you may want to know different results. For instance, a patient needing to shrink a tumor for surgery may want to look at the PR+CR result. A patient desiring long-term stability may want to minimize the PD result.
Blood-Related Adverse Events
The table below contains more detail and 95% confidence intervals on blood-related adverse events. Studies with fewer participants have less certain results and wider confidence intervals. For adverse event analysis, I included both locally advanced and metastatic patients from each study.
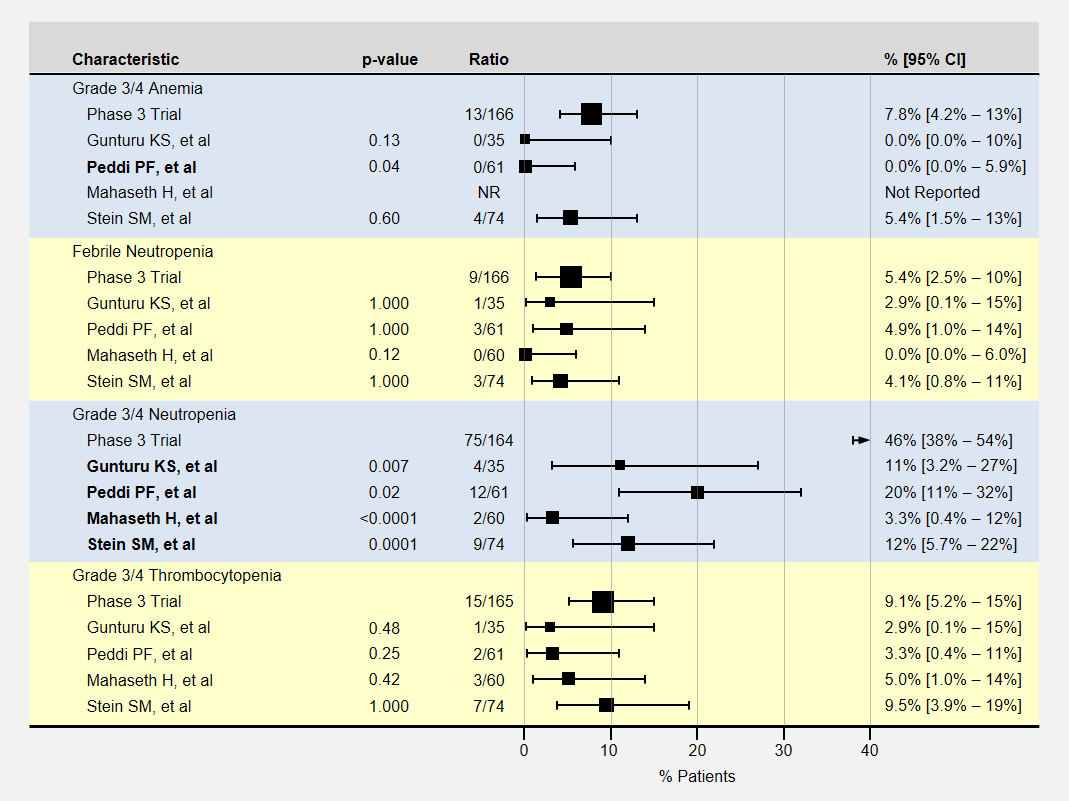
Blood Related Adverse Events in Low-Dose FOLFIRINOX Studies
Most adverse events for lower dose FOLFIRINOX were less than the baseline phase 3 clinical trial. However, except for neutropenia, sample sizes or adverse effects were too small to show statistical significance.
Note that the phase 3 clinical trial’s neutropenia rates were especially high. Three studies (Gunturu, Mahaseth, and Stein) used C-GSF for all participants which likely reduced the rate of neutropenia. The Peddi study used C-GSF at higher rates than the phase 3 trial, also reducing the neutropenia rates.
Non-Blood Related Adverse Events
The table below contains more detail and 95% confidence intervals on non-blood-related adverse events. For adverse event analysis, I included both locally advanced and metastatic patients from each study.
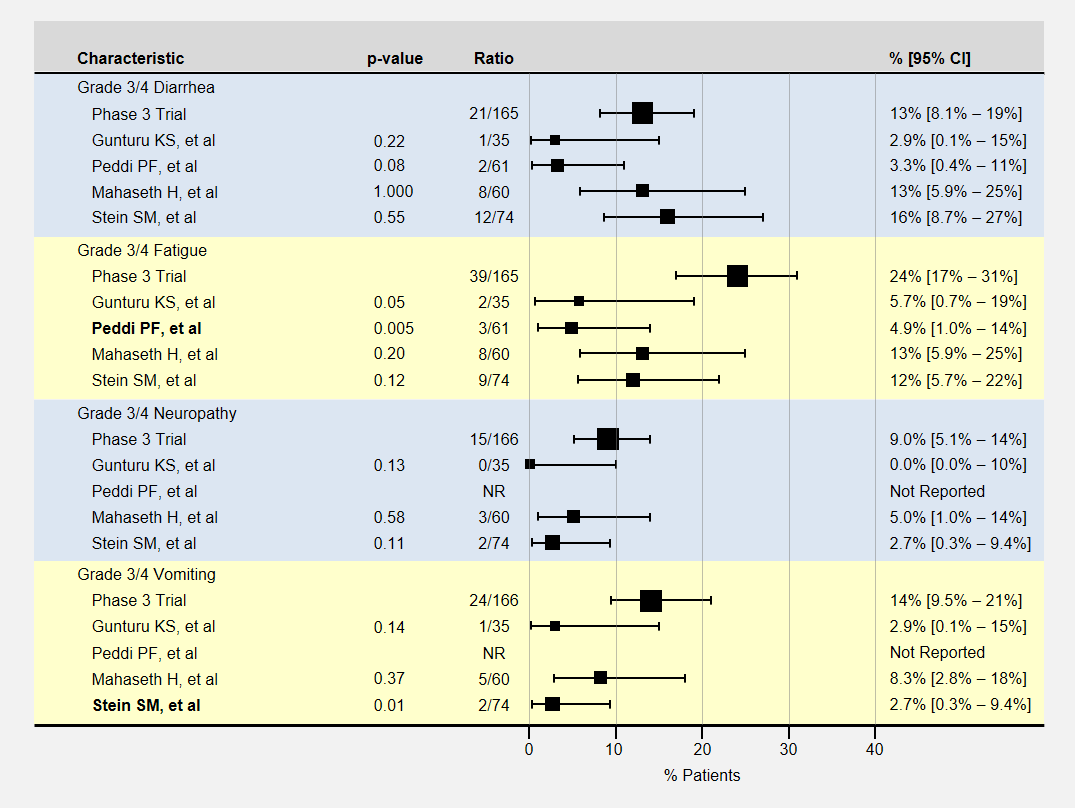
Non-Blood Related Adverse Events in Low-Dose FOLFIRINOX Studies
Here again, most adverse events for lower dose FOLFIRINOX were less than the baseline phase 3 clinical trial, with sample sizes usually too small to show a statistically significant effect. The Peddi study had significantly less fatigue, and the Stein SM study with a 25% reduction in the initial dose of irinotecan and bolus 5-FU had significantly less vomiting.
How Low Can We Go?
Let’s take a look back at the phase 1 dose escalation trial for FOLFIRINOX6. The study establisged a MTD for oxaliplatin and irinotecan at 85mg/m2 delivered over 120 minutes and 220mg/m2 delivered over 90 minutes respectively. The reduced the recommended level to 85/180 mg/m2 when they realized the cumulative effect would not allow patients to maintain a 2 week schedule.
The dose escalation started with lower oxaliplatin/irinotecan doses as shown in the following table. Important to this discussion, almost every dose level showed anti-tumor activity – including complete responses at the two lowest levels. Participants experienced no dose-limiting toxicities at the three lowest dose levels.
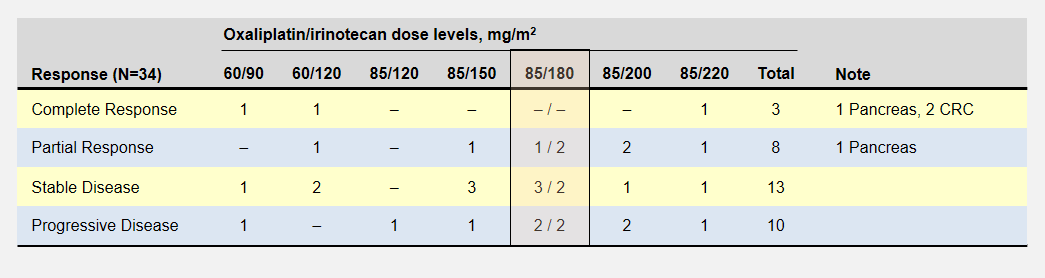
Patient Responses in Phase 1 FOLFIRINOX Dose Escalation Study
The primary goal to determine the dose-limiting toxicity, not effectiveness, opened enrollment to 41 patients with 8 different types of cancers. Of the 6 pancreatic cancer patients, 1 enjoyed a complete and another a partial response (dose levels not specified).
Summary
These peer-reviewed, published studies proved evidence of low dose FOLFIRINOX efficacy similar to the phase 3 trial results. Positive or negative differences in progression-free or overall survival rates cannot be seen with the small studies thus far.
Even with these small study sizes, we have statistically significant evidence of a reduction in toxicity with the low dose FOLFIRINOX regimens.
In the FOLFIRINOX dose escalation trial, patients at the two lowest oxaliplatin/irinotecan levels recorded complete responses with no limiting side effects.
Low dose FOLFIRINOX is better tolerated with significant anti-tumor activity. Oncologists should consider this regimen as an option for patients desiring efficacy but unwilling to endure severe toxic events. Patient experiences with low dose FOLFIRINOX will produce more retrospective studies that will help pinpoint a most effective dose.
I propose that oncologists start patients with low dose FOLFIRINOX and in the absence of severe side effects, increase the dose. The first rounds are often the most difficult as a patient must quickly learn how to deal with chemotherapy-induced nausea and fatigue in addition to their new cancer diagnosis.
References
[1]Conroy T, et al. (2011 May 12) “FOLFIRINOX versus gemcitabine for metastatic pancreatic cancer”. N Engl J Med 364(19):1817-25 PMID: 21561347.
[2]Gunturu KS, et al. (2013 Mar) “FOLFIRINOX for locally advanced and metastatic pancreatic cancer: single institution retrospective review of efficacy and toxicity”. Med Oncol 30(1):361 PMID: 23271209.
[3]Peddi PF, et al. (2012 Sep 10) “Multi-institutional experience with FOLFIRINOX in pancreatic adenocarcinoma”. JOP 13(5):497-501 PMID: 22964956.
[4]Mahaseth H, et al. (2013 Nov) “Modified FOLFIRINOX regimen with improved safety and maintained efficacy in pancreatic adenocarcinoma”. Pancreas 42(8):1311-5 PMID: 24152956.
[5]Stein SM, et al. (2016 Mar 29) “Final analysis of a phase II study of modified FOLFIRINOX in locally advanced and metastatic pancreatic cancer”. Br J Cancer 114(7):737-43 PMID: 27022826.
[6]Ychou, et al. (2003 Mar) “An open phase I study assessing the feasibility of the triple combination: oxaliplatin plus irinotecan plus leucovorin/ 5-fluorouracil every 2 weeks in patients with advanced solid tumors”. Ann Oncol 14(3):481-9 PMID: 12598357.